There have recently been two stimulating posts regarding error control for Bayes factors. (Stimulating enough to get me to write this, at least.) Daniel Lakens commented on how Bayes factors can vary across studies due to sampling error. Tim van der Zee compared the type 1 and type 2 error rates for using p-values versus using BFs. My comment is not so much to pass judgment on the content of the posts (other than this quick note that they are not really proper Bayesian simulations), but to suggest an easier way to do what they are already doing. They both use simulations to get their error rates (which can take ages when you have lots of groups), but in this post I’d like to show a way to find the exact same answers without simulation, by just thinking about the problem from a slightly different angle.
Lakens and van der Zee both set up their simulations as follows: For a two sample t-test, assume a true underlying population effect size (i.e., δ), a fixed sample size per group (n1 and n2), and calculate a Bayes factor comparing a point null versus an alternative hypothesis that assigns δ a prior distribution of Cauchy(0, .707) [the default prior for the Bayesian t-test]. Then simulate a bunch of sample t-values from the underlying effect size, plug them into the BayesFactor R package, and see what proportion of BFs are above, below or between certain values (both happen to focus on 3 and 1/3). [This is a very common simulation setup that I see in many blogs these days.]
I’ll just use a couple of representative examples from van der Zee’s post to show how to do this. Let’s say n1 = n2 = 50 and we use the default Cauchy prior on the alternative. In this setup, one can very easily calculate the resulting BF for any observed t-value using the BayesFactor R package. A BF of 3 corresponds to an observed | t | = ~2.47; a BF of 1/3 corresponds to | t | = ~1. These are your critical t values. Any t value greater than 2.47 (or less than -2.47) will have a BF > 3. Any t value between -1 and 1 will have BF < 1/3. Any t value between 1 and 2.47 (or between -1 and -2.47) will have 1/3 < BF < 3. All we have to do now is find out what proportion of sample t values would fall in these regions for the chosen underlying effect size, which is done by finding the area of the sampling distribution between the various critical values.
easier type 1 errors
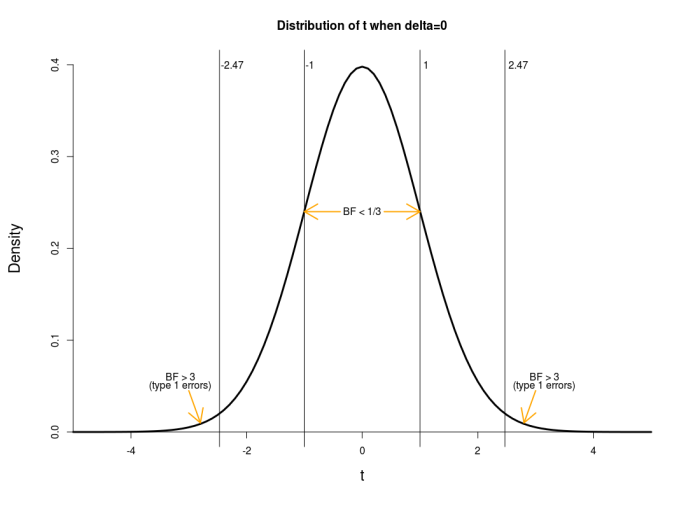
If the underlying effect size for the simulation is δ = 0 (i.e., the null hypothesis is true), then observed t-values will follow the typical central t-distribution. For 98 degrees of freedom, this looks like the following.

I have marked the critical t values for BF = 3 and BF = 1/3 found above. van der Zee denotes BF > 3 as type 1 errors when δ = 0. The type 1 error rate is found by calculating the area under this curve in the tails beyond | t | = 2.47. A simple line in r gives the answer:
2*pt(-2.47,df=98)
[.0152]
The type 1 error rate is thus 1.52% (van der Zee’s simulations found 1.49%, see his third table). van der Zee notes that this is much lower than the type 1 error rate of 5% for the frequentist t test (the area in the tails beyond | t | = 1.98) because the t criterion is much higher for a Bayes factor of 3 than a p value of .05. [As an aside, if one wanted the BF criterion corresponding to a type 1 error rate of 5%, it is BF > 1.18 in this case (i.e., this is the BF obtained from | t | = 1.98). That is, for this setup, 5% type 1 error rate is achieved nearly automatically.]
The rate at which t values fall between -2.47 and -1 and between 1 and 2.47 (i.e., find 1/3 < BF < 3) is the area of this curve between -2.47 and -1 plus the area between 1 and 2.47, found by:
2*(pt(-1,df=98)-pt(-2.47,df=98))
[1] 0.3045337
The rate at which t values fall between -1 and 1 (i.e., find BF < 1/3) is the area between -1 and 1, found by:
pt(1,df=98)-pt(-1,df=98)
[1] 0.6802267
easier type 2 errors
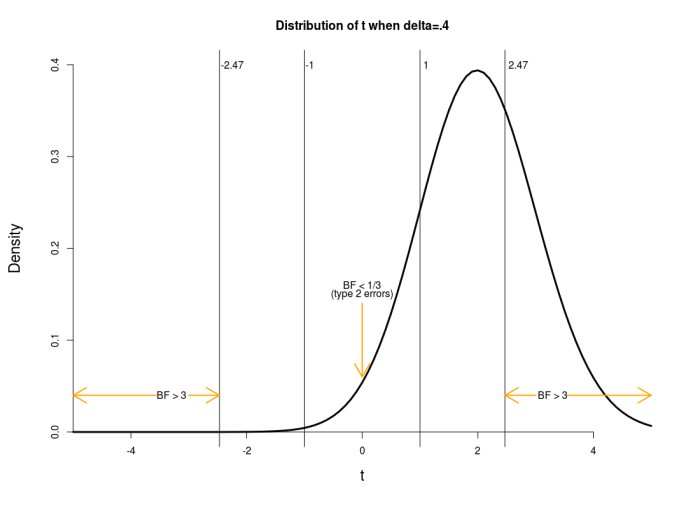
If the underlying effect size for the simulation is changed to δ = .4 (another one of van der Zee’s examples, and now similar to Lakens’s example), the null hypothesis is then false and the relevant t distribution is no longer centered on zero (and is asymmetric). To find the new sampling distribution, called the noncentral t-distribution, we need to find the noncentrality parameter for the t-distribution that corresponds to δ = .4 when n1 = n2 = 50. For a two-sample t test, this is found by a simple formula, ncp = δ / √(1/n1 + 1/n2); in this case we have ncp = .4 / √(1/50 + 1/50) = 2. The noncentral t-distribution for δ=.4 and 98 degrees of freedom looks like the following.

I have again marked the relevant critical values. van der Zee denotes BF < 1/3 as type 2 errors when δ ≠ 0 (and Lakens is also interested in this area). The rate at which this occurs is once again the area under the curve between -1 and 1, found by:
pt(1,df=98,ncp=2)-pt(-1,df=98,ncp=2)
[1] 0.1572583
The type 2 error rate is thus 15.7% (van der Zee’s simulation finds 16.8%, see his first table). The other rates of interest are similarly found.
Conclusion
You don’t necessarily need to simulate this stuff! You can save a lot of simulation time by working it out with a little arithmetic plus a few easy lines of code.
[…] 3 (20/07/2016): Read this post by Alexander Etz where he explains why you don’t even need the simulations I used below, […]
[…] fair much better than p-values in terms of controlling false-positives (Type I errors), but this is simply because BF > 3 requires more evidence than a p < […]
Hi Alex,
thank you for your nice post!
There might be a small mistake in the ncp formula: I think it should be ncp = δ * 1/√(1/n1 + 1/n2) [Note the 1/…; see e.g. p.144 http://www.stata-journal.com/sjpdf.html?articlenum=st0062%5D Nevertheless, your result is ncp=2, which is the solution using the correct formula.
Best Patrick